Introduction
We have been diligently tallying our seasonal rainfall since 2013 throughout the El Nino drought years. Since 2014 South Africa has faced severe droughts, crippling the water supply, which treatened to leave Cape Town without water in 2018!
The deepening of the drought years also meant that I had scaled down the vegetable garden immensely as we were working ourselves to the bone to keep the plants watered. Alas, this had very little success since we were merely keeping the plants alive, they were simply surviving not thriving – and we had very little produce to show for the work.
The Data
This season we have seen a massive change in the rainfall season and equipped with the hard numbers, lets compare the season for our area to the national and historical averages:
Annual rainfall ‘average’ for South Africa (which includes the desert areas) pre- El Nino: 470 mm (1901-2016), which is half that of the rest of the world at 985 mm per year! Here is a comparative chart for monthly rainfall (barchart) and temperature (line chart), from the World Bank:


From the charts above comparing the 1901 – 2016 and the 1991 – 2016 it is very noticeable that the average temperature has increased (dramatically so for winter). The rainfall seemed to have shifted towards and increase for Jan-Dec and decrease in Feb-Mar with the rest of the season remaining fairly stable.
My records for rainfall in our area during the main crop production months:
Main Growing Season (Roodepoort, South Africa, 2013-2019, Aug-Jan)
| Rainfall | 2013/14 | 2014/15 | 2015/16 | 2016/17 | 2017/18 | 2018/19 | 2019/20 |
| Aug | 5.5 | 5 | 10 | 0 | 0 | 0 | 0 |
| Sep | 3.7 | 9 | 51 | 2 | 0 | 7.5 | 4 |
| Oct | 109 | 29.5 | 11.5 | 46.5 | 65 | 35 | 4 |
| Nov | 89 | 111.3 | 34.5 | 97 | 143.5 | 41 | 128.5 |
| Dec | 173.8 | 125.5 | 124.5 | 104 | 102 | 104 | 254 |
| Jan | 163 | 126.5 | 143.7 | 205 | 77 | 127 | 99 |
| Total | 544 | 406.8 | 375.2 | 454.5 | 387.5 | 314.5 | 489.5 |
From this table we can clearly see that the rainfall for the Aug – Oct months are drying up, whereas the December months are becoming the most prominent rainfall season (a trend already seen in the historical world bank data.)
Here is another set of tables to illustrate the rainfall on a yearly and monthly basis for 2013 – 2019:


From the yearly and monthly tables the prominent December rainfall trend is evident as well as the reduction of rain during Aug – Oct. We also notice that both Feb and/or March maintain their high rainfall contributions. Thus, we definitely see a shift in our rainfall season from traditionally starting in August to only starting in November! This effectively decreases the active growing season by 3 months!
Fortunately, this year has meant a major recovery for South Africa’s dams, rivers and underground water reserves. However, our planting season has become impacted and this will determine when we can truly start planting food gardens at large scale – especially considering that many seedlings become established in the Aug – Oct months before the full heat of the summer.
Thus, it remains a priority to capture and store your own water reserves so that you can offset the lack of rain during the Aug – Oct months, water that must be collected and stored over the winter months. Additionally, it means using water sparingly during the winter months and likely forgoing heavy water/nutrient users such as cauliflower and broccoli for the preferential planting of drought resistant and/or smaller crops such as beans, peas, alfalfa, spinach and pak choi in winter.
I would also highly recommend planting fruit trees that are late carriers rather than early. This means that the trees would miss the chilly August winds and frost as well as letting the trees catch the first rains later in the year.
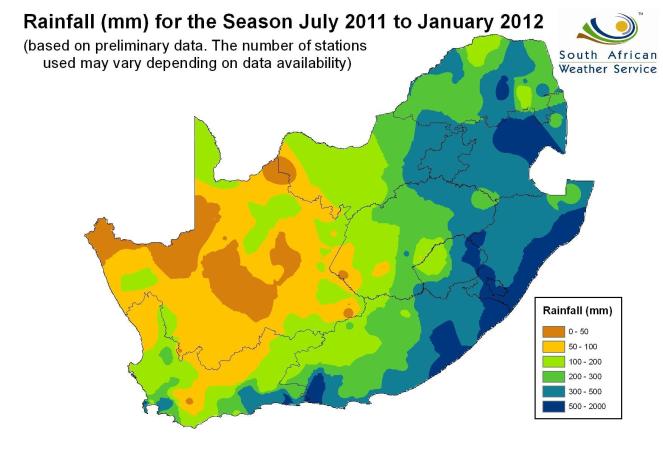
Here are two historical maps of precipitation from the SA Weather Service for more comparisons:

Conclusion
Our region is experiencing a noticeable change in rainfall patterns and we as South Africans truly need to move away from using clean drinking water for pools, garden water features, washing the car or pavement, watering the lawn etc. We all need to start working towards both collecting and saving rainwater for the garden and house as well as reserving clean tap water exclusively for drinking, cooking and personal hygiene. Our household uses 71 liters per person per day and we are do not even feel cheated at all!
How? We have several rain water collection tanks (we have 16000 L worth on the property), please see my post about rain and grey water collection and use. The City of Cape Town government has several great resources on water saving in and around the house/office:
- Top ways to save water
- Water-saving tips/checklist to help avoid Day Zero
- Safe use of Grey Water
- Find and Fix Leaks
- Water Conservation: Smart Office Handbook (only pages 57-65)
- Smart Office Handbook: A Guide to Greening Your Office (full book)

5 thoughts on “Seasonal Rainfall Update: 2020”